

Weighted Mean Formula in Research: How to Apply and Interpret It
Research data rarely treats every value equally. A survey may need some answers to count more than others, a Likert item collects counts for each answer, and a meta-analysis trusts precise studies more than rough ones. The weighted mean formula handles all three. This guide shows how to apply the weighted mean formula in research and how to interpret the result.
The weighted mean formula
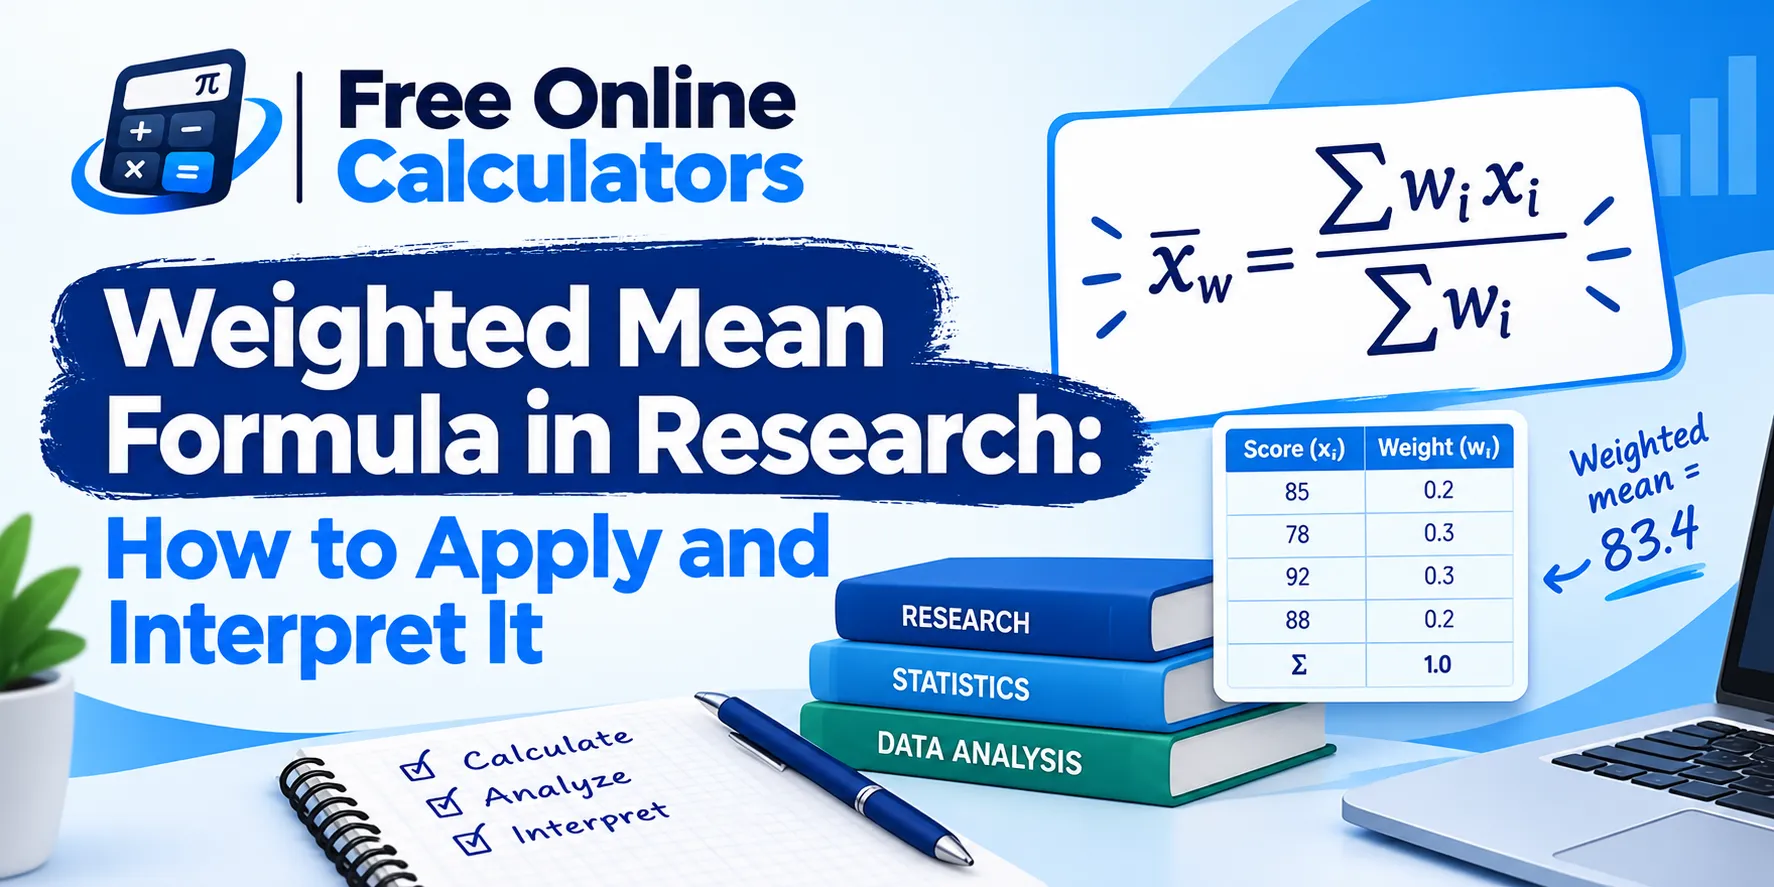
x̄w = Σ(wi × xi) ÷ Σwi
xi is each value and wi is its weight. Multiply each value by its weight, add the products, and divide by the sum of the weights. When every weight is equal, the formula reduces to the ordinary mean. The average calculator returns both the plain and the weighted mean for a list of values.
Weighted mean for Likert scale data
For a Likert item, the values are the scale points and the weights are the number of respondents who chose each one.
Example
100 respondents rate the statement “The training was useful” on a 5-point scale:
| Response | Scale value (x) | Respondents (w) | w × x |
|---|---|---|---|
| Strongly agree | 5 | 40 | 200 |
| Agree | 4 | 30 | 120 |
| Neutral | 3 | 15 | 45 |
| Disagree | 2 | 10 | 20 |
| Strongly disagree | 1 | 5 | 5 |
| Total | 100 | 390 |
Weighted mean = 390 ÷ 100 = 3.90
Interpreting the weighted mean
Many theses split the 1 to 5 range into five equal bands of 0.80, since (5 − 1) ÷ 5 = 0.80:
| Weighted mean | Interpretation |
|---|---|
| 4.21 to 5.00 | Strongly agree |
| 3.41 to 4.20 | Agree |
| 2.61 to 3.40 | Neutral |
| 1.81 to 2.60 | Disagree |
| 1.00 to 1.80 | Strongly disagree |
A weighted mean of 3.90 falls in the Agree band. Report the standard deviation or the full distribution beside it, because a mean of 3.0 can come from everyone choosing Neutral or from a split between the two extremes.
Survey weights
When a sample over-represents a group, survey weights pull the estimate back toward the population.
Example
A sample has 60 women and 40 men, but the population is half and half. Each woman gets a weight of 50 ÷ 60 = 0.833 and each man 50 ÷ 40 = 1.25. Women rate satisfaction at 7.0 on average and men at 6.0.
- Unweighted mean: (60 × 7.0 + 40 × 6.0) ÷ 100 = 6.6
- Weighted mean: (50 × 7.0 + 50 × 6.0) ÷ 100 = 6.5
The weighted figure is the better estimate for the whole population.
Effective sample size
Unequal weights reduce precision. Kish’s effective sample size measures how much:
neff = (Σw)² ÷ Σw²
Four respondents with weights 1, 1, 2, and 4 give 8² ÷ (1 + 1 + 4 + 16) = 64 ÷ 22 = 2.9, so they carry about as much information as three equally weighted people.
Inverse-variance weights in meta-analysis
A fixed-effect meta-analysis weights each study by the inverse of its variance, w = 1 ÷ SE², so precise studies count more.
| Study | Effect | SE | Weight 1/SE² | w × effect |
|---|---|---|---|---|
| A | 0.50 | 0.10 | 100 | 50.0 |
| B | 0.30 | 0.20 | 25 | 7.5 |
| C | 0.40 | 0.05 | 400 | 160.0 |
| Total | 525 | 217.5 |
Pooled effect = 217.5 ÷ 525 = 0.414, with a standard error of 1 ÷ √525 = 0.044. The plain mean of the three effects would be 0.40; study C, the most precise, pulls the pooled value toward its own result.
How to report a weighted mean
- State what the weights are and where they came from.
- Give the weighted mean, its spread, and the number of cases.
- Show the unweighted mean too when the gap between them matters.
- For Likert data, give the interpretation bands you used.
For more everyday cases such as grades, prices, and forecasts, see the weighted average examples.
To run the same calculation on your own data in a spreadsheet, follow the steps for a weighted average in Google Sheets.
Common mistakes
- Dividing by the number of values. Divide by the sum of the weights.
- Averaging percentages from groups of different size. Weight each group by its count.
- Treating the Likert mean as exact. The scale is ordinal, so pair the mean with the distribution.
Quick reference
Weighted mean = Σ(w × x) ÷ Σw. Check your research figures with a free online calculator from CalculateGuide.