

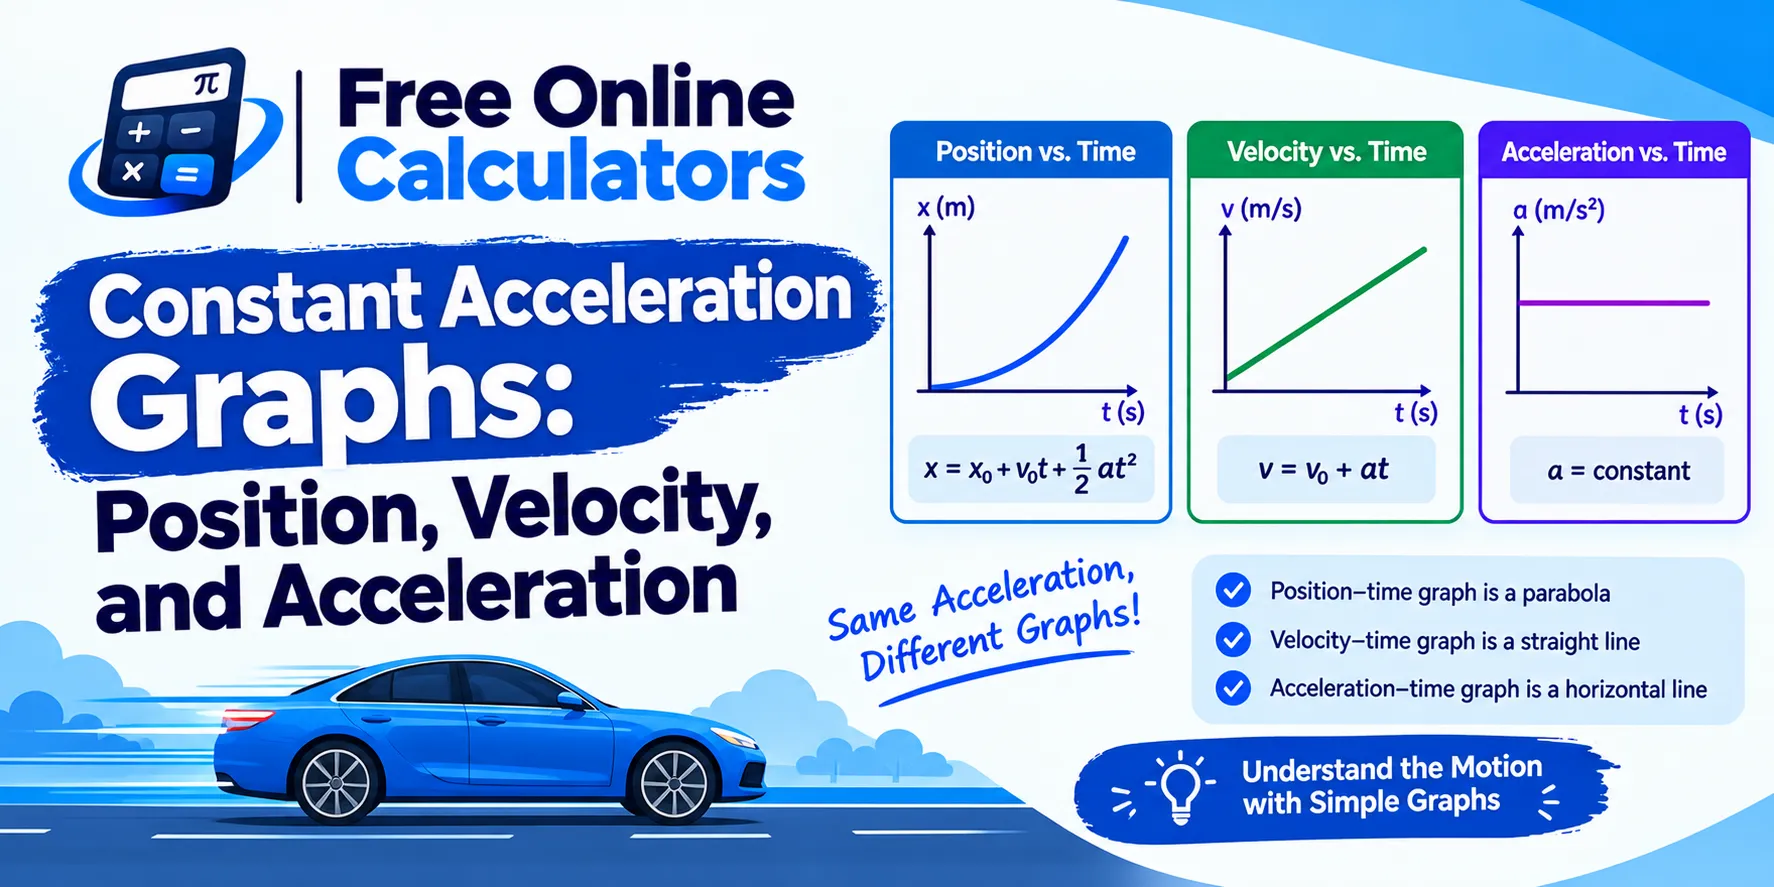
Constant Acceleration Graphs: Position, Velocity, and Acceleration
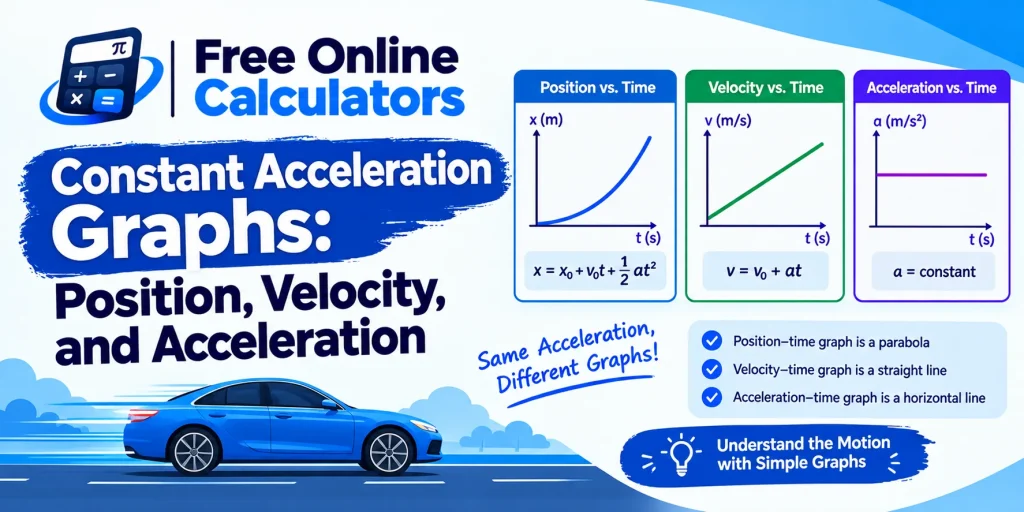
Motion with constant acceleration has a clear signature on every graph. A position-time graph curves, a velocity-time graph is a straight sloped line, and an acceleration-time graph is flat. This guide shows each constant acceleration graph, how to read slope and area from them, and how to go from one graph to the next.
The three constant acceleration graphs
| Graph | Shape under constant acceleration | Slope gives | Area under it gives |
|---|---|---|---|
| Position-time | Parabola (curve) | Velocity | Not used |
| Velocity-time | Straight sloped line | Acceleration | Displacement |
| Acceleration-time | Horizontal line | Jerk (zero here) | Change in velocity |
Velocity-time graph for uniform acceleration
Under uniform acceleration, velocity changes by the same amount every second, so the velocity time graph for constant acceleration is a straight line:
v = u + a × t
The line starts at the initial velocity u on the vertical axis, and its slope is the acceleration a. A steeper line means a larger acceleration, a downward slope means slowing down, and a horizontal line means zero acceleration. These equations are covered in full in the velocity and acceleration formulas guide.
Area under the velocity-time graph
The area between the line and the time axis is the displacement. For a straight line, that area is a trapezoid:
s = (u + v) ÷ 2 × t
This is the same as s = u × t + ½ × a × t², the familiar distance equation written as a shape.
Position-time graph for constant acceleration
Because displacement grows with t², the position-time graph is a parabola. It curves upward when the object speeds up in the positive direction and flattens out as it slows. The slope of a tangent at any point is the velocity at that moment, which is why the curve gets steeper as speed rises.
Acceleration-time graph
For constant acceleration, the acceleration-time graph is a flat line at height a. The area under it, a × t, is the change in velocity over that time. A line above the axis means acceleration in the positive direction; below the axis means negative acceleration.
Acceleration-time graph to velocity-time graph
To turn an acceleration-time graph into a velocity-time graph, add the area under the acceleration line to the starting velocity, one time step at a time.
Worked example
A cart starts at 4 m/s and the acceleration-time graph shows a flat line at 2 m/s² from 0 to 5 seconds.
- Area under the acceleration line: 2 × 5 = 10 m/s. That is the gain in velocity.
- Final velocity: 4 + 10 = 14 m/s.
- Draw the velocity-time graph as a straight line from (0 s, 4 m/s) to (5 s, 14 m/s).
- Displacement from the velocity-time area: (4 + 14) ÷ 2 × 5 = 45 m.
Check with the distance equation: 4 × 5 + ½ × 2 × 5² = 20 + 25 = 45 m. The acceleration calculator gives the slope for any pair of speeds and times.
Motion with constant acceleration graph: free fall
A dropped ball is the classic case. Taking down as positive and ignoring air drag, its acceleration-time graph is a flat line at 9.81 m/s², its velocity-time graph is a straight line from 0 rising by 9.81 m/s each second, and its position-time graph is a parabola. The free fall calculator gives the speed and drop distance at any time.
How to read a graph quickly
- Straight line on velocity-time: constant acceleration; the slope is the value.
- Curve on position-time: the object is accelerating; a straight line would mean steady speed.
- Line crossing the time axis on velocity-time: the object stops and turns around at that instant.
- Area below the time axis: counts as negative displacement, motion in the other direction.
Common mistakes
- Reading height as acceleration. On a velocity-time graph, the height is speed; the slope is acceleration.
- Using the slope of a position-time curve between two far points. That gives average velocity, not the velocity at an instant.
- Forgetting the starting value. An acceleration-time graph gives the change in velocity, so add the initial velocity.
To practice the numbers behind these graphs, work through the acceleration formula examples.
Quick reference
Velocity-time slope is acceleration and its area is displacement; acceleration-time area is the change in velocity. Check your graph values with a free online calculator from CalculateGuide.